Predicting Ground Level Ozone Concentration from Urban Satellite and Street Level Imagery using Multimodal CNN
This was our class project for Stanford CS230 “Deep Learning” class during the Winter 2021 quarter. The project was featured as one of the Outstanding projects for the Winter 2021 quarter. You can find our final report here.
Description
This project examines the relationship between the level of ozone concentration in urban locations and their physical features through the use of Convolutional Neural Networks (CNNs). We train two models, including one trained on satellite imagery (“Satellite CNN”) to capture higher-level features such as the location’s geography, and the other trained on street-level imagery (“Street CNN”) to learn ground-level features such as motor vehicle activity. These features are then concatenated to train neural network (“Concat NN”) on this shared representation and predict the location’s level of ozone as measured in parts per billion.
Data
We obtained ozone measurements (parts per billion) for 12,976 semi-unique locations with ozone levels information mostly located in North America from AirNow.
Our satellite imagery dataset was constructed using the Google Earth Engine API: for each location labeled with an ozone reading, we retrieve one satellite image centered at that location from the Landsat 8 Surface Reflectance Tier 1 Collection with a resolution of 224 $\times$ 224 pixels which represents 6.72 km $\times$ 6.72 km. We use 7 bands from this collection: RGB, ultra blue, near infrared, and two shortwave infrared bands. We preprocess each of our images by adding a cloud mask per pixel and then computing the per pixel and band mean composite of all the available images for the year 2020.
The street-level imagery dataset was constructed using the Google Maps Street View API. For each location labeled with an ozone level, we randomly sample 10 geospatial points within 6.72 km from the measurement point.
Here we can see some examples from our dataset:

Network architecture
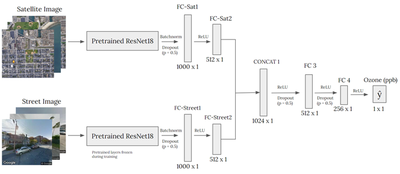
We train the two CNNs separately on the satellite and street-level imagery, both using a ResNet-18 architecture implemented in PyTorch and pretrained on the ImageNet dataset. The models are trained separately as the nature of the features they need to learn to associate with ozone concentration is quite different for each dataset. Transfer learning is used for both CNNs to leverage lower-level features learned on the ImageNet dataset. The ResNet-18 architecture was slightly adapted for our particular task; in the case of the satellite imagery, the CNN’s input layer was modified to accommodate for the image’s seven channels and was initialized using Kaiming initialization.
After training both CNNs separately to predict the ozone reading for each location, we extract 512 features for each satellite and each street image. These are concatenated to create a feature vector of size 1,024 representing the satellite image and a particular street view of a given location. We then train a Concatenated Feedforward Neural Network (NN) using these multiple representations of each location to predict the location’s average ozone level in 2020.

More details about regularization, the tuning process of hyperparameters and training of the network can be found in the report.
Results
After tuning our hyperparameters and training our models, we obtain the following performance (Root Mean Square Error in our test set):
| Satellite Model | Street-level Model | Concatenated Model | |
|---|---|---|---|
| Test RMSE (ppb) | 12.48 | 20.64 | 11.70 |
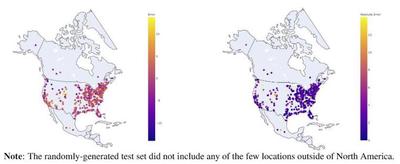
We can also visually compare our predictions for the test with ground truth values in the following figure:
